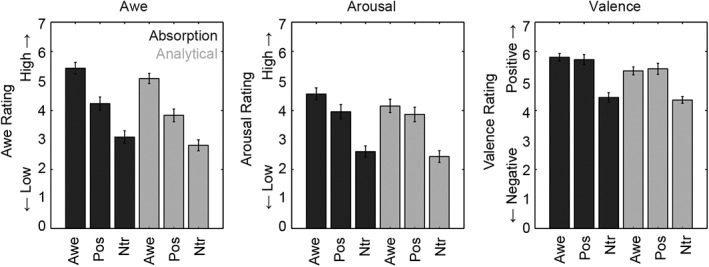
Figure 2.

Subjective ratings for awe (left graph), arousal (middle graph), and valence (right graph) for the different videos (awe = awe videos; Pos = positive videos; Ntr = neutral videos) and the different tasks (dark bars = absorption; light bars = analytical condition). Error bars represent standard errors
