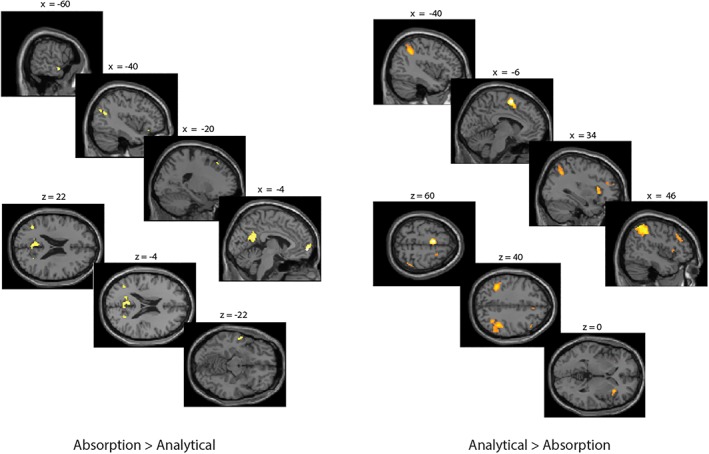
Figure 3.

Activation maps representing areas that showed a stronger activation for the absorption compared to the analytical condition (left side) and for the analytical compared to the absorption condition (right side). Results are thresholded at p < .05 FWE‐corrected at the whole‐brain level. Error bars represent standard errors [Color figure can be viewed at http://wileyonlinelibrary.com]
