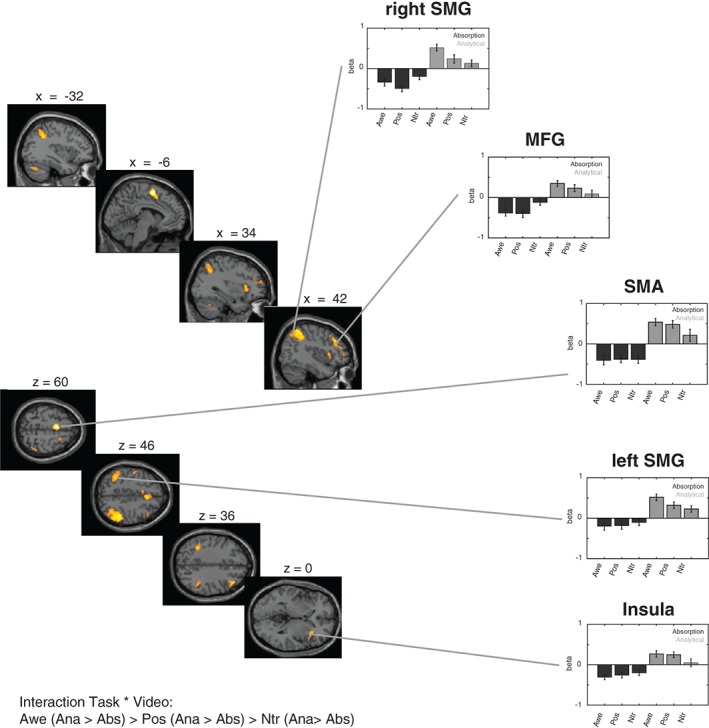
Figure 5.

Interaction effect between task and video: analytical > absorption. Activation maps (left side) and beta‐estimates (right side) for areas that showed a differential activation as a function of both task (absorption vs. analytical) and video (awe, positive, or neutral). The figure presents the contrast whereby the difference between the analytical and the absorption condition was larger for the awe compared to the positive and for the positive compared to the neutral condition. Results are thresholded at p < .05 FWE‐corrected at the whole‐brain level. Error bars represent standard errors [Color figure can be viewed at http://wileyonlinelibrary.com]
