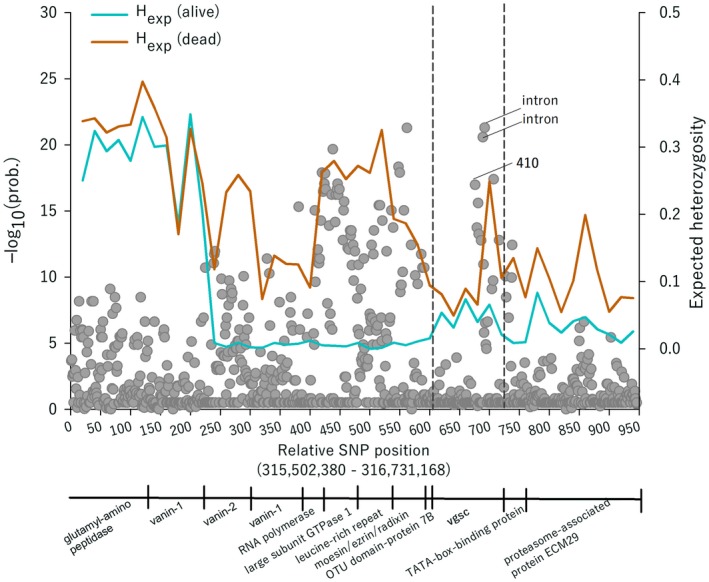
Figure 4.

Signatures of a selective sweep by voltage‐gated sodium channel (vgsc). The lines show the expected heterozygosity H exp for single‐nucleotide polymorphisms (SNPs) at vgsc and upstream and downstream genes. Dots show the individual SNP −log10(prob). The physical boundaries between genes are shown below the plot.
