Figure 3.

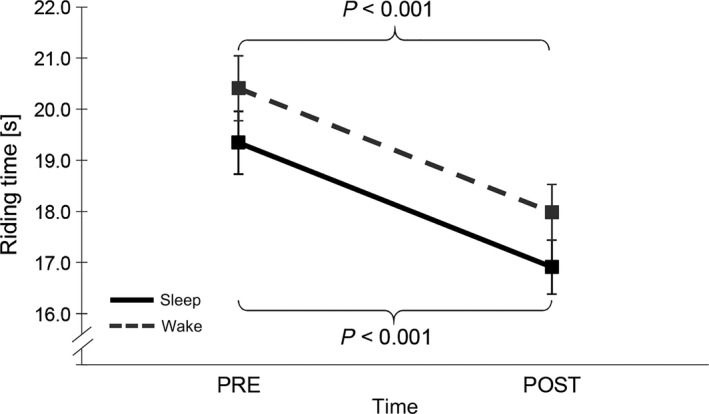
Riding time in the sleep and wake groups. Both the sleep and wake groups significantly reduce their riding time over the retention interval. High riding time values indicate low performance. Error bars represent standard error of the mean

Riding time in the sleep and wake groups. Both the sleep and wake groups significantly reduce their riding time over the retention interval. High riding time values indicate low performance. Error bars represent standard error of the mean