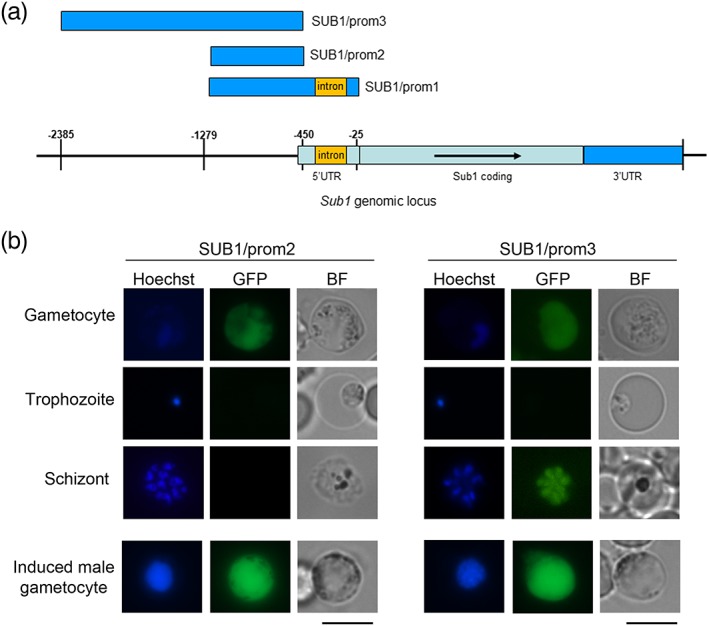
Figure 1.

Sub1 promoter analysis. (a) Schematic illustrating sub1 genomic locus; in blue are highlighted the regions cloned in the SUB1/prom plasmids. (b) In vivo imaging of SUB1/prom gametocytes from synchronous infections and SUB1/prom schizonts from in vitro culture. The SUB1/prom2 line is shown as an example of the gametocyte‐specific GFP expression in both SUB1/prom1 and SUB1/prom2 lines. In the SUB1/prom3 line, GFP signal was detected also in mature schizonts. In all SUB1/prom lines, at 10 min postinduction, GFP fluorescence intensity increased in activated male gametocytes, with clearly identifiable replicating nuclei. All the images were acquired with the same settings. Nuclei are stained with Hoechst. BF, bright field; GFP, green fluorescent protein. Scale bar 5 μm
