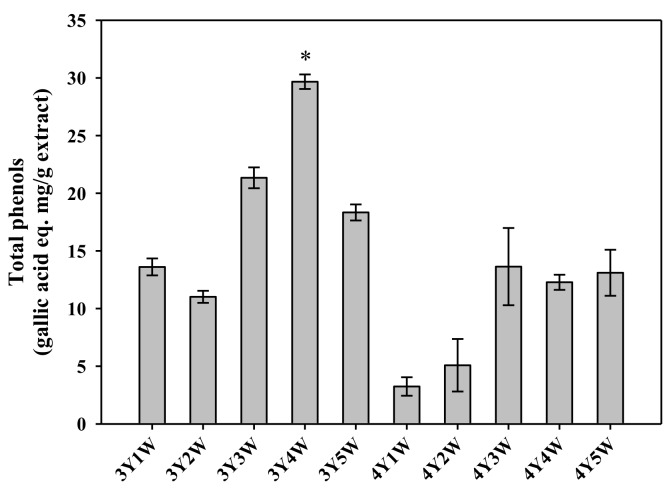
Figure 3.
Total phenolic contents of ginseng berry extracts harvested at various time points. Rectangular bars and their error bars represent means and standard deviations, respectively (n = 3). The ‘mYnW’ on the x-axis means m-year-old ginseng berry harvested in the nth week of July. *, significantly different from other groups.

