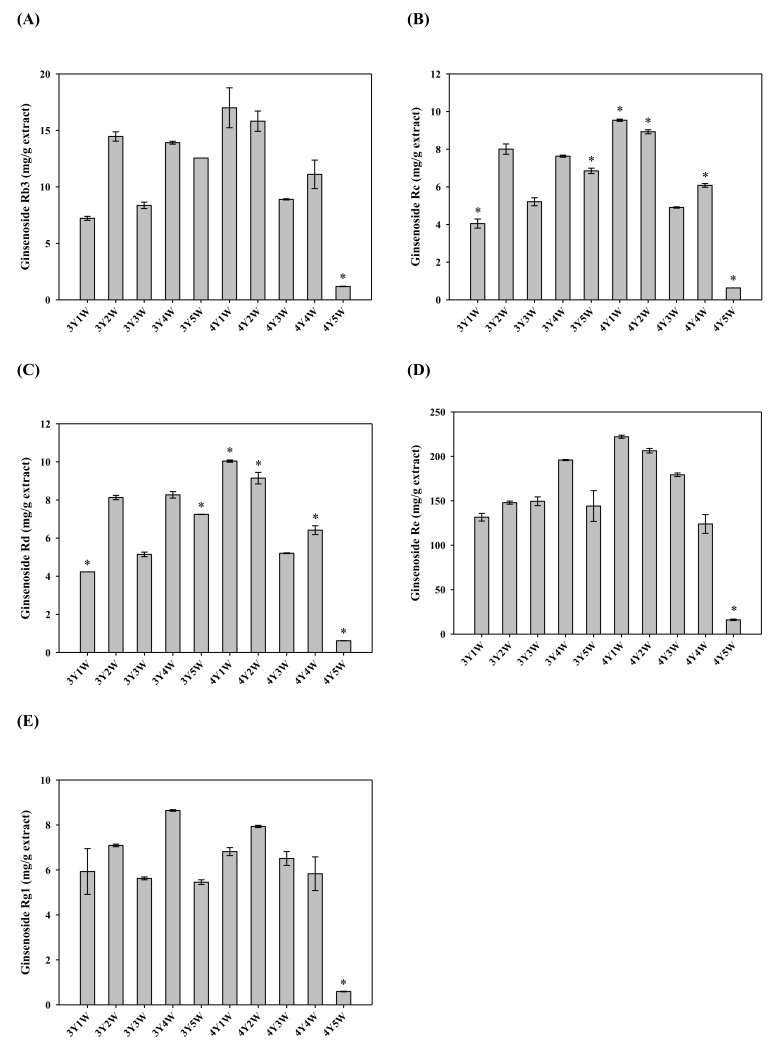
Figure 6.
Contents of ginsenosides Rb3 (A), Rc (B), Rd (C), Re (D), and Rg1 (E) in ginseng berry extracts harvested at various time points. Rectangular bars and their error bars represent means and standard deviations, respectively (n = 3). The ‘mYnW’ on the x-axis means m-year-old ginseng berry harvested in the nth week of July. *, significantly different from other groups.

