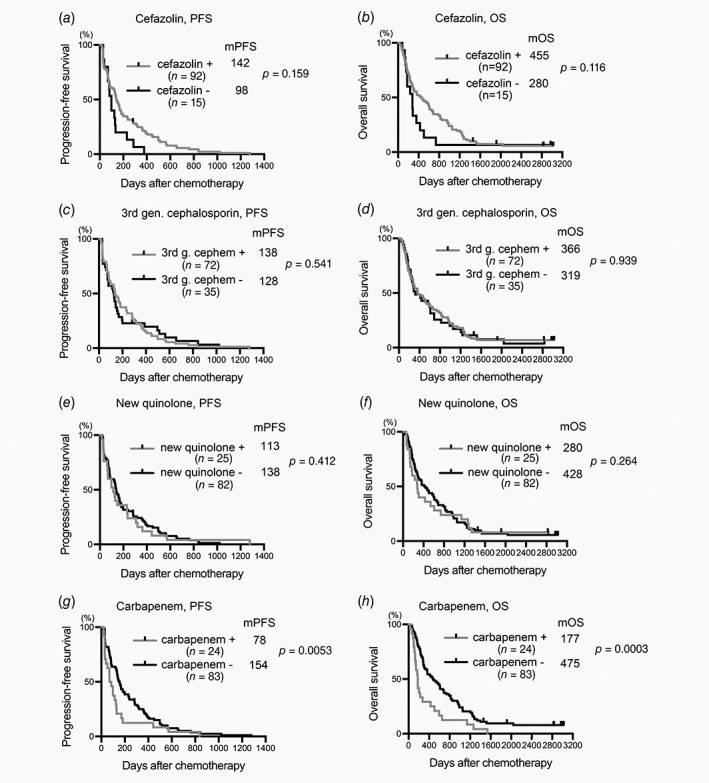
Figure 1.

Plots of PFS and OS drawn according to antibiotics received. Plots of PFS (a, c, e and g) and OS (b, d, f and h) were drawn by the Kaplan–Meier method. Median PFS (mPFS, days), mOS time (days), number of patients in each category (n) and p are shown. +, received indicated antibiotic; −, did not receive indicated antibiotic.
