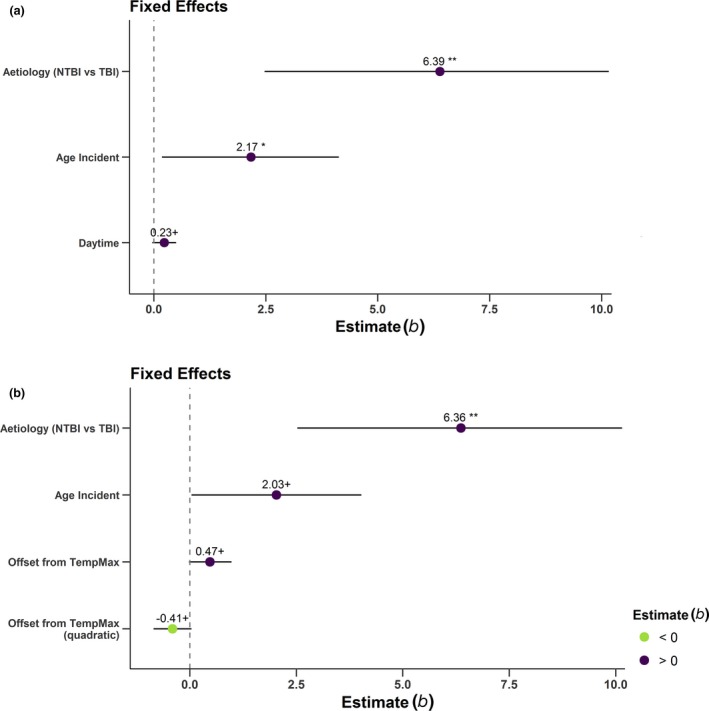
Figure 3.

Predictions for fixed effects in Models 2a, 2b. (a) Predictions [estimates (b)] for fixed effects of aetiology, age at incident and daytime on CRS‐R sum scores (Model 2a). The figure illustrates that TBI, a higher age at the time of incident and, by trend, a later daytime, predict higher CRS‐R sum scores. (b) Predictions [estimates (b)] for fixed effects of aetiology, age at incident and offset from the temperature maximum as a quadratic function on CRS‐R sum scores (Model 2b). The figure illustrates that TBI and, by trend, higher age at incident and less deviation from the temperature maximum, predict higher CRS‐R scores. Horizontal bars represent 95% confidence intervals. Asterisks indicate significance: +P < 0.1, *P < 0.05, **P < 0.01. b, standardized regression coefficient; NTBI, non‐traumatic brain injury; TBI, traumatic brain injury. [Colour figure can be viewed at wileyonlinelibrary.com]
