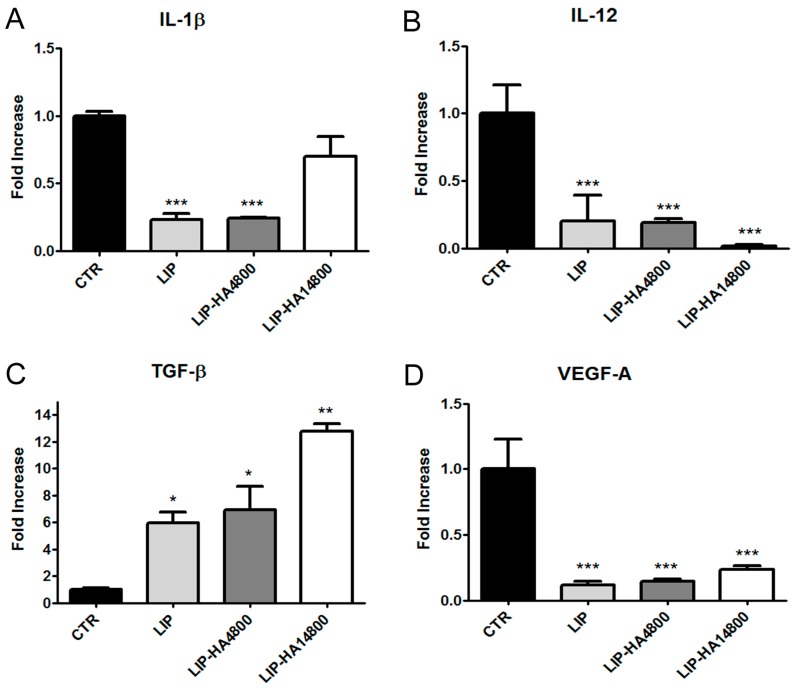
Figure 5.
Analysis of transcript levels of IL-1β (A), IL-12 (B), TGF-β1 (C), and VEGF-A (D) in differentiated THP-1 cells. Quantitative real-time PCR (qPCR) of mRNAs of THP-1 cells treated for 1 h with LIP, LIP-HA4800, and LIP-HA14800. mRNA values are expressed as fold increase over control values after normalization to the GAPDH gene expression and are the means ± SEM of three independent experiments. *, p < 0.05, **, p < 0.01, ***, p < 0.001 vs. CTR.

