
Figure 3.
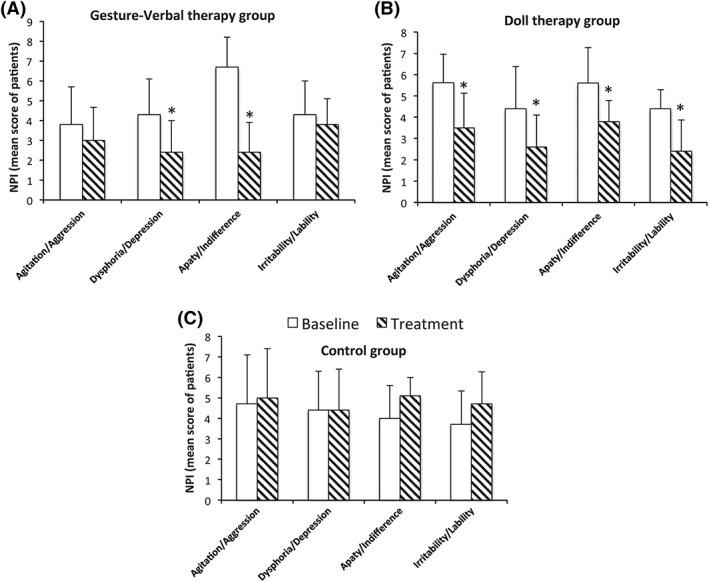
NPI subdomains preintervention and postintervention assessments in (A) gesture‐verbal therapy, (B) doll therapy, and (C) control groups. The mean values of the total NPI in the 3 experiment groups with standard deviation are shown. Significant differences with respect to the baseline (pretreatment) are indicated with asterisk (*P < .05)