Figure 4.

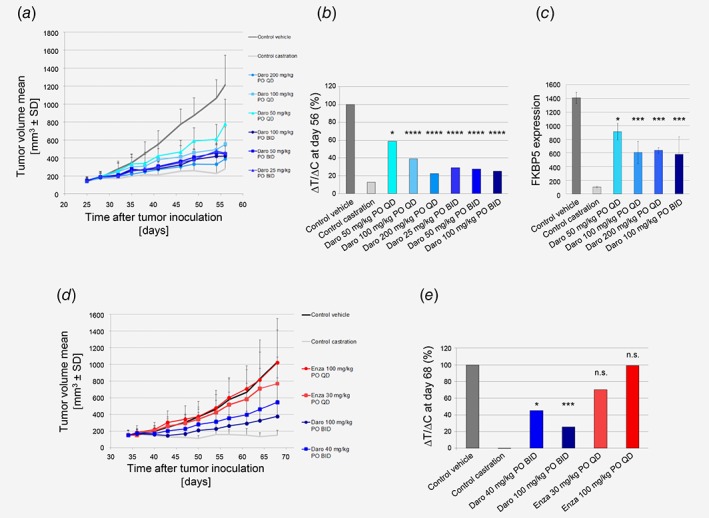
In vivo efficacy studies in prostate cancer models. (a) Darolutamide strongly inhibits LAPC‐4 tumor growth inhibition as seen by measuring mean tumor volume during treatment. (b) % ΔT/ΔC volume at Day 56. Significance versus control vehicle group was determined at Day 56 using one‐way ANOVA with Dunnett's post hoc test on Log‐transformed tumor volumes: *p = 0.04; ****p = 0.0001. (c) FKBP5 gene expression levels in tumors harvested 4 hr after final dosing (n = 3). Significance versus control vehicle group was determined using unpaired t‐test. *p = 0.02; ***p < 0.005. (d) Darolutamide strongly inhibits KuCaP‐1 tumor growth as seen by measuring mean tumor volume during treatment. (e) % ΔT/ΔC volume at Day 68. Significance versus control vehicle group was determined at Day 68 using one‐way ANOVA with Dunnett's post hoc test on Log‐transformed tumor volumes: *p = 0.0169; ***p = 0.0001, n.s., not significant. Daro, darolutamide; Enza, enzalutamide. [Color figure can be viewed at wileyonlinelibrary.com]
