
Figure 1.
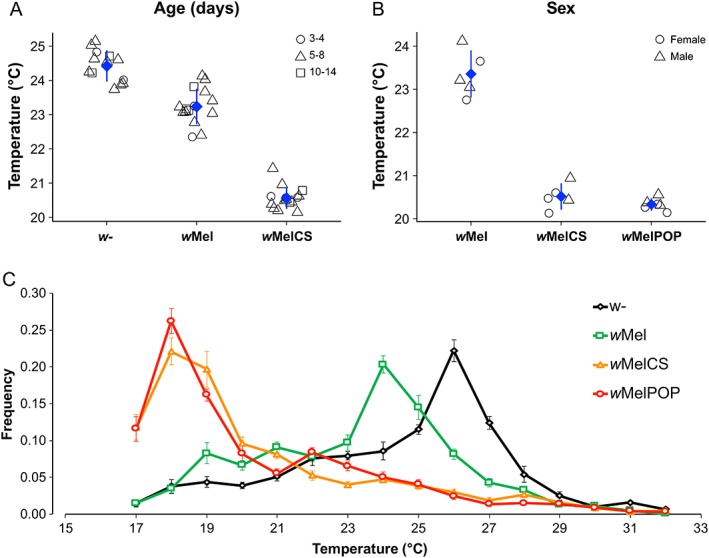
Thermal preference of Drosophila with and without Wolbachia infections. Panels A and B show average T p (blue diamonds) with respect to age (3–4, 5–7, or 10–14 days post eclosion, n = 4370 excluding flies infected with wMelPop) and sex (male or female; n = 1718, excluding uninfected flies) respectively. Each symbol represents the average T p for a replicate at a given factor level of either age (circle: 3–4 days, triangle: 5–8 days and square: 10–14 days) or sex (circle: females, triangle: males). Panel C shows line plots with relative proportions of flies observed at a given temperature. Each line represents the average proportion of flies which were either uninfected (w‐; black diamonds) or infected with wMel (green circles), wMelCS (orange triangles), or wMelPop (red squares). The error bars represent standard errors for average frequencies at a given temperature across all replicated experiments carried out for each infection type. We found that infected flies exhibit significantly lower thermal preference compared with uninfected flies. [Color figure can be viewed at wileyonlinelibrary.com]