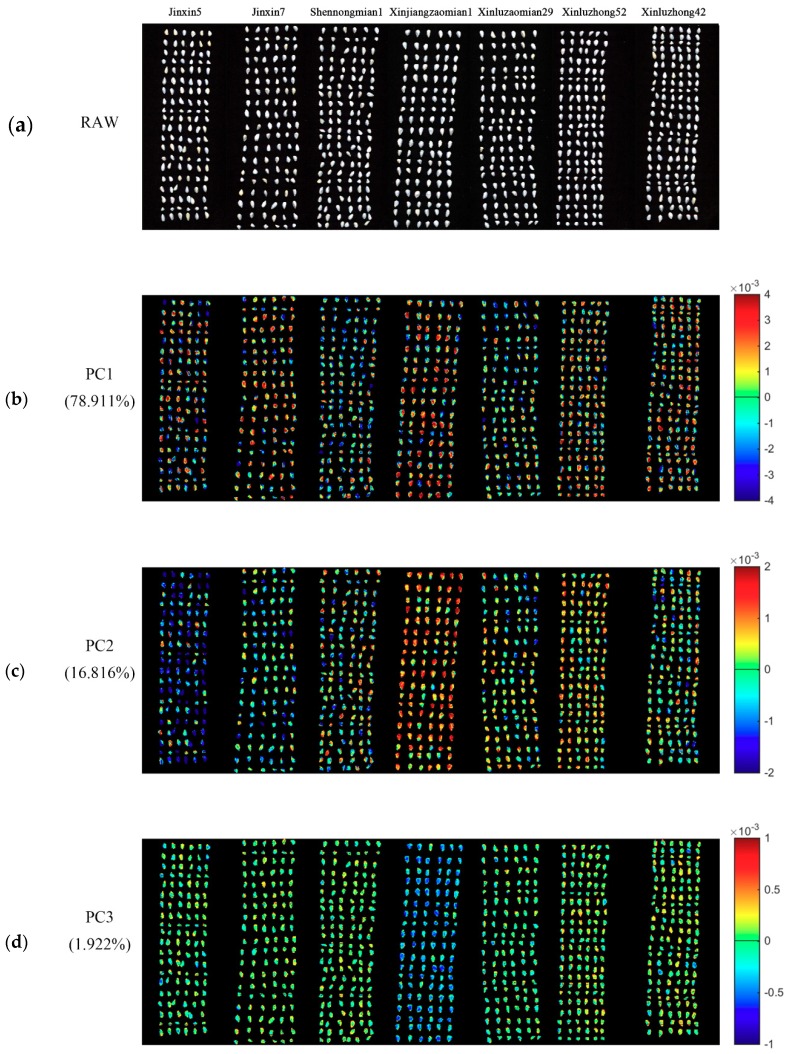
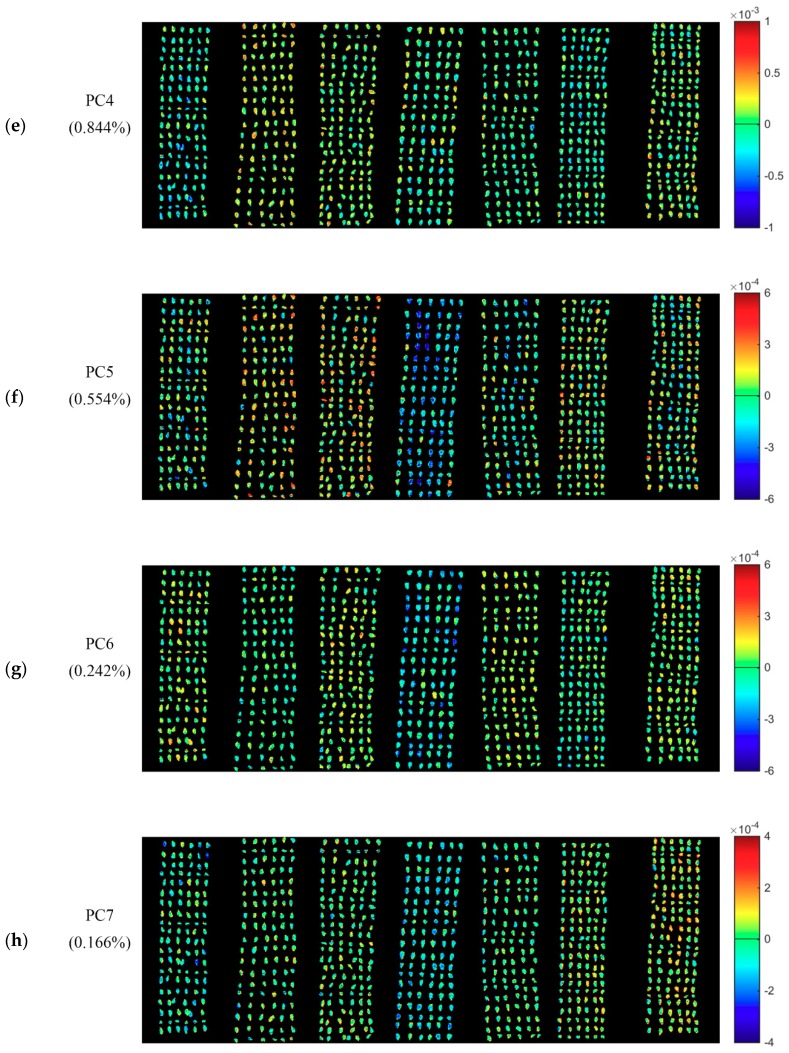
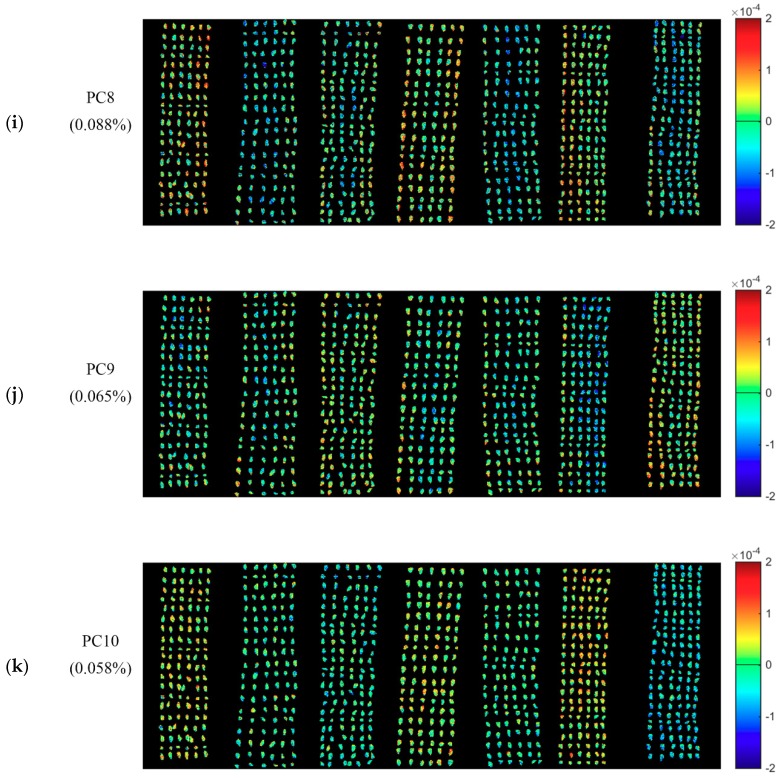
Figure 2.
Pseudo raw image of the seven varieties of cotton seeds and the PCA score images of the first ten PCs. The letter (a) represent the pseudo raw image (1000, 1200 and 1400 nm); (b–k) represent the PCA score images of PC1–PC10. Numbers in the brackets are percentage of explained total variance.


