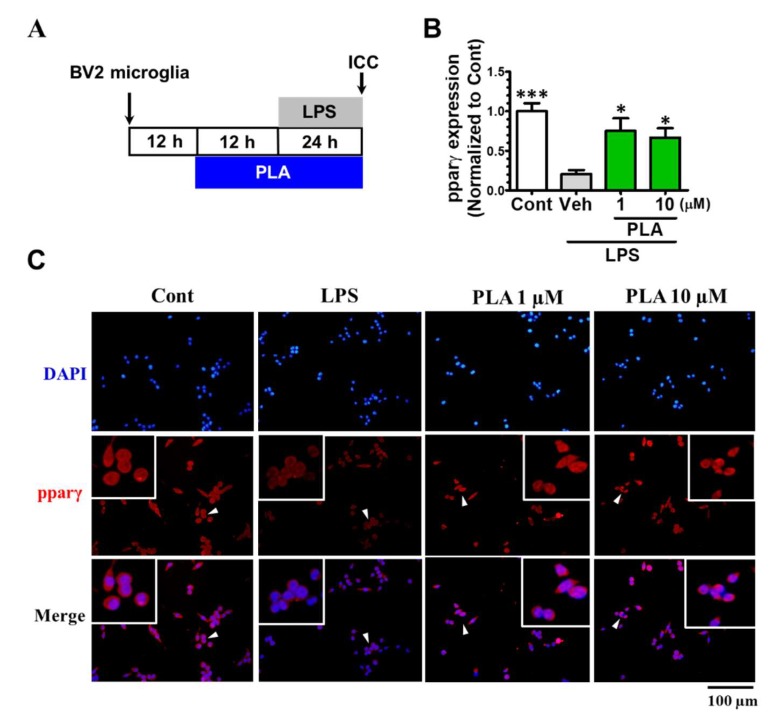
Figure 5.
Effects of platycodigenin (PLA) on LPS-induced expression of PPARγ. BV2 microglia were cultured for 12 h and pretreated with PLA (1 and 10 μM) or control (Cont, 0.1% DMSO) for another 12 h, followed by stimulation with LPS (100 ng/mL) for 24 h. The cells were fixed and immunostained for pparγ. The fluorescent intensity of the pparγ positive cells were measured. (A) Experimental schedule. (B) The expression of PPARγ per cell were quantified. (C) The representative images immunostained for PPARγ. The data are normalized to the control and shown as the mean ± SEM of three independent experiments. Ten images were captured of each group in the independent experiment. *p < 0.05 and ***p < 0.001 versus vehicle (Veh), Kruskal-Wallis one-way analysis of variance by ranks test.

