Figure 2.

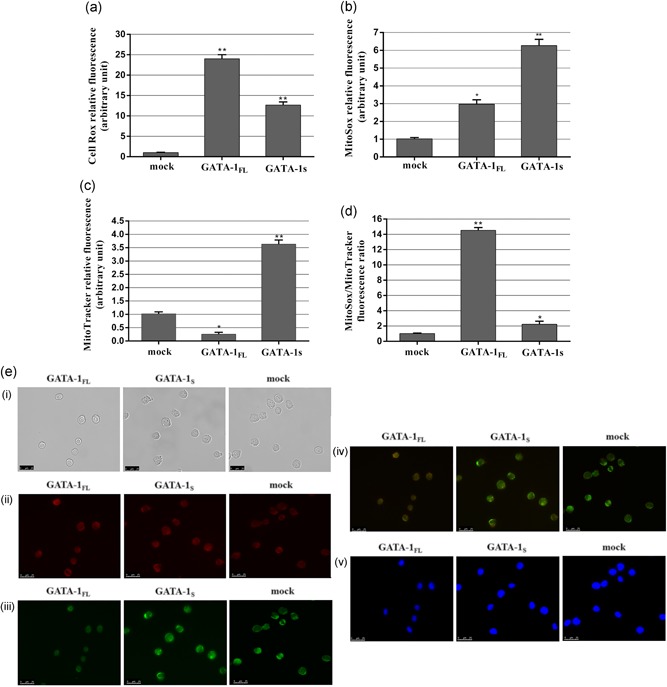
Evaluation of ROS production in K562 cells overexpressing GATA‐1FL and GATA‐1S isoforms. (a) Cytoplasmatic ROS levels detected by flow cytometry analysis in cells overexpressing GATA‐1 isoforms and in mock control after CellRox staining. (b) Mitochondrial superoxide levels detected by flow cytometry analysis in cells overexpressing GATA‐1 isoforms and in mock control stained with MitoSOX red mitochondrial superoxide reagent. (c) Total mitochondrial mass detected by flow cytometry analysis in cells overexpressing GATA‐1 isoforms and in mock cells stained with MitoTracker green FM reagent. (d) Mitochondrial superoxide/mitochondrial mass ratio in cells overexpressing GATA‐1 isoforms and in mock control. All data are presented as the means ± SD (n = 3 in each group). Statistical analysis was performed by one‐way ANOVA, followed by Dunnett's multiple comparison test where appropriate. Differences were considered significant when p < 0.05 and highly significant when p < 0.0001. *p < 0.05; **p < 0.0001, versus mock control. (e) Fluorescent microscopy images of cells overexpressing GATA‐1 isoforms and mock cells. (i) bright field images; (ii) fluorescence images of K562 stained with MitoSox red mitochondrial dye; (iii) fluorescence images of K562 stained with MitoTracker green FM dye; (iv) merged images; (v) nuclei stained with 4′,6′‐diamidino‐2‐phenylindole (DAPI). All data shown are representative of three independent experiments. ANOVA: analysis of variance; ROS: reactive oxygen species; SD: standard deviation [Color figure can be viewed at wileyonlinelibrary.com]
