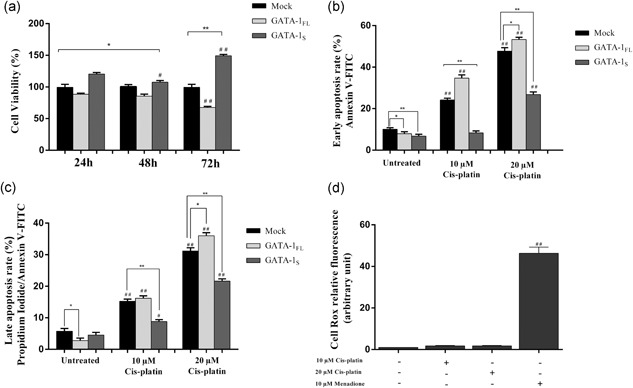
Figure 4.

Flow cytometric analysis of cell viability and apoptosis rate in K562 cells overexpressing GATA‐1 isoforms. (a) Cell viability assessed by the MTT assay in mock control and in GATA‐1 overexpressing K562 cells at 24, 48, and 72 hr after transfection. (b) Early apoptosis rate detected with Annexin V staining in mock control and in K562 cells overexpressing GATA‐1 isoforms 48 hr after transfection. (c) Late apoptosis rate detected with Annexin V/propidium iodide staining in mock control and in K562 cells overexpressing GATA‐1 isoforms 48 hr after transfection. Apoptosis was evaluated in untreated cells and in cells treated for 16 hr with 10 and 20 μM cisplatin, respectively. (d) Cytoplasmatic ROS levels detected by flow cytometry analysis in K562 cells stained with CellRox dye after 10 and 20 μM cisplatin exposure. Menadione treatment (10 μM) was used as a positive control for cytoplasmatic ROS production. All data shown represent the mean ± SD of three independent experiments. Statistical analysis was performed by one‐way ANOVA, followed by Dunnett's multiple comparison test where appropriate. Differences were considered significant when p < 0.05 and highly significant when p < 0.0001. # p < 0.05, ## p < 0.0001 versus untreated control group, *p < 0.05, **p < 0.0001 versus mock control. ANOVA: analysis of variance; ROS: reactive oxygen species; SD: standard deviation
