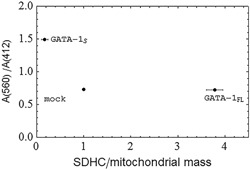
Figure 8.

Evaluation of the redox state of cytochrome b‐560 with respect to SDHC levels in K562 cells overexpressing GATA‐1 isoforms. The ratio of the integrated area A (560) under the absorbance dip at 560 nm to the integrated area A (412) under the absorbance peak at 412 nm versus the SDHC levels normalized to the mitochondrial mass. The integrated spectral data are obtained from the absorbance spectra of cells transfected with expression vectors for GATA‐1FL or GATA‐1S, respectively, and with mock control. The positional error bars are the standard deviation of the means (n = 3) of the measurements of the SDHC/mitochondrial mass ratio in cells overexpressing GATA‐1 isoforms. SDHC: succinate dehydrogenase complex
