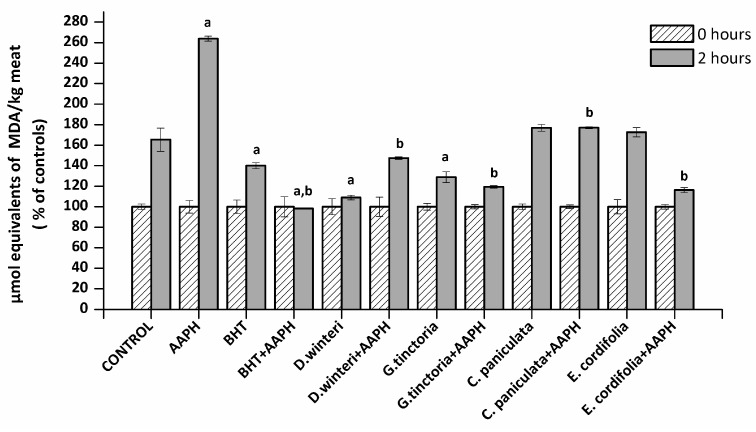
Figure 1.
Concentration of malondialdehyde (MDA) in the different samples analyzed, control, 2,2’-azo-bis(2-amidinopropane) dihydrochloride (AAPH, 10 mM), butylated hydroxyanisole (BHT) (1 mM) and plant extracts (0.1 g/mL), (p < 0.05; a significant difference compared to control group; b significant difference compared to AAPH group, ANOVA, Tukey test). Data are expressed as percentages of initial concentration and represent the mean ± SD for of three replicates in triplicate.

