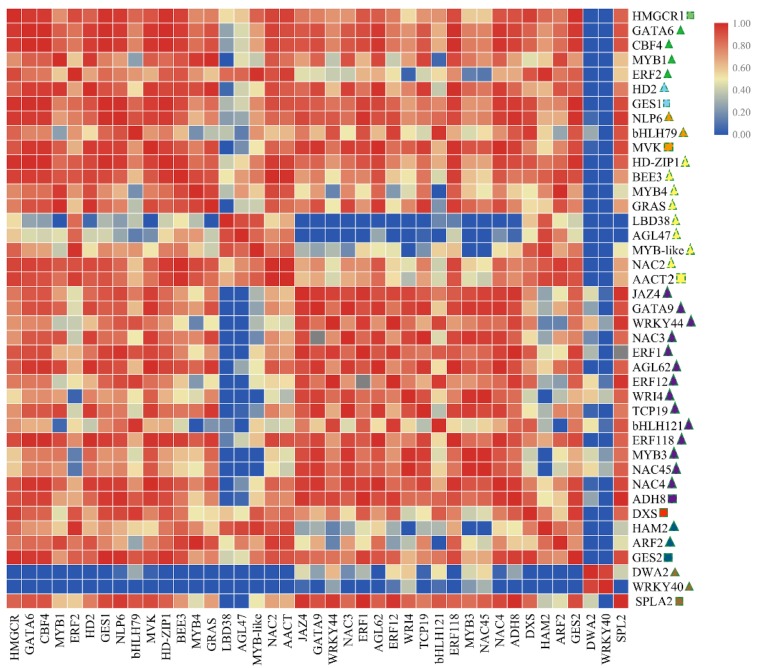
Figure 7.
The matrix correlation of genes and TFs involved in volatile biosynthesis (these genes and TFs expression in F1 generation are higher than parental lines). The heatmap drawing was conducted by correlation between genes analyzed by the Spearman test using SPSS 17.0 software and visualized by the TBtools software. Square indicates structural gene; Triangular indicates transcription factors; The same color indicates the same expression pattern in four tea tree.

