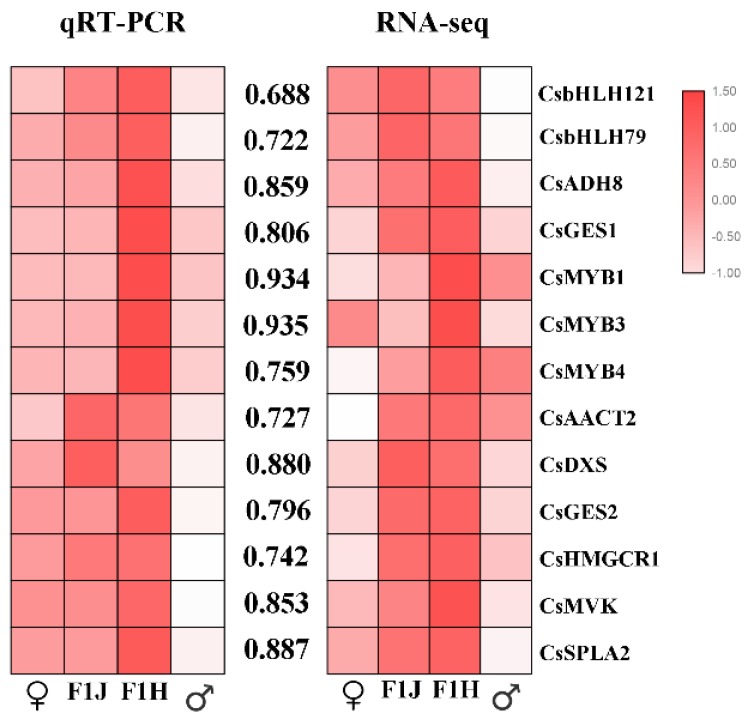
Figure 8.
Correlation analysis of candidate genes. The values between the two heatmaps represent correlation value between the expression profiles obtained from RNA-seq and RT-qPCR analysis for each gene. The heatmap drawing was conducted by correlation between genes analyzed by the Spearman test using SPSS 17.0 software and visualized by the TBtools software. “♂”means male parent; “♀” means female parent; “F1J” means JGY; “F1H” means HGY.

