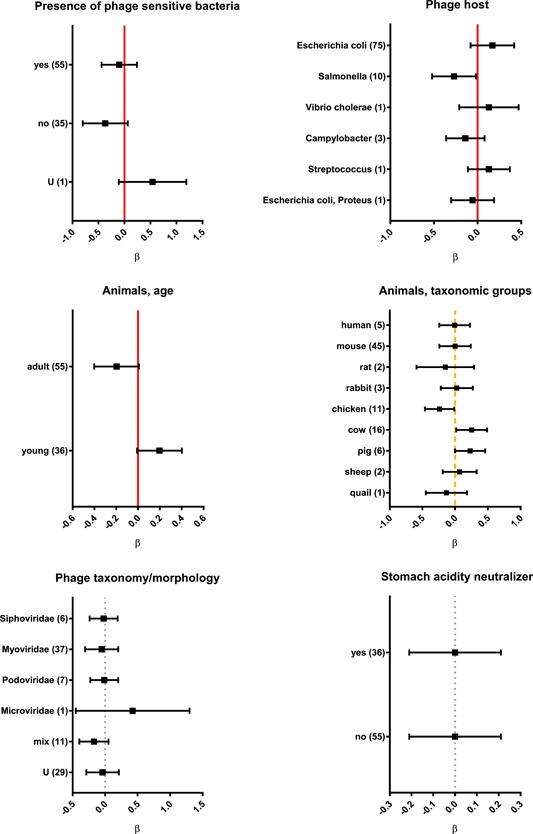
Figure 2.

Factors affecting phage gut transit in animals and humans analyzed by categories, results of systematic analysis presented in forest plots. Vertical lines represent average effect within a category, horizontal bars represent confidence interval 95%; red (normal line)—highly significant influence of a factor, yellow (dashed line)—significant influence of a factor, gray (dotted line)— insignificant, U—unspecified, and ß—regression coefficient. Number of relevant reports available for analysis is given in parentheses. (Tables S1 and S2) [Color figure can be viewed at wileyonlinelibrary.com]
