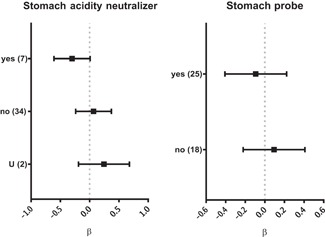
Figure 4.

Selected factors specific for phage penetration after oral administration, results of systematic analysis presented in forest plots. Vertical lines represent average effect within a category, horizontal bars represent confidence interval 95%. No statistical significance was observed (gray, dotted line). U—unspecified and ß—regression coefficient. Number of relevant reports available for analysis is given in parentheses (Table S2)
