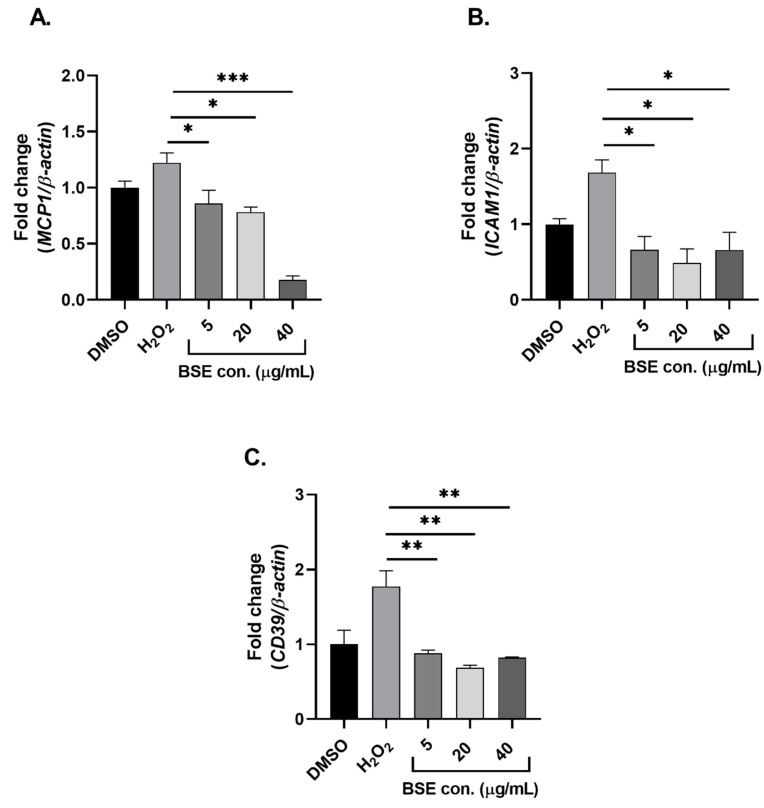
Figure 3.
Changes in the gene expression profile of inflammatory mediators [MCP1 (A), ICAM1 (B), and CD39 (C)] with BSE pre-treatment on oxidative stress-induced HUVECs. n = 3. Level of significance indicated as * p < 0.05, ** p < 0.01, *** p < 0.001 one-way ANOVA with Tukey’s multiple comparison post hoc test. Data is presented as mean ± SEM. DMSO—Dimethyl sulfoxide, HUVEC—human umbilical vein endothelial cells, BSE—black sorghum extract.

