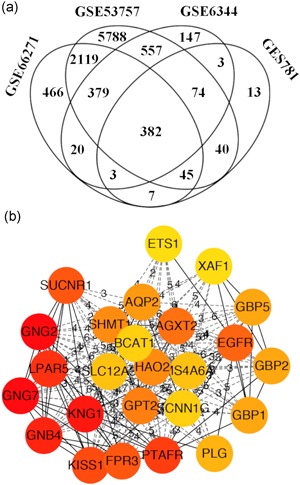
Figure 1.

Venn diagram and protein‐protein interaction (PPI) analysis differentially expressed genes (DEGs). (a) DEGs were selected with Log (fold‐change) > 1 and adj. p ≤ 0.01 among GSE781, GSE6344, GSE53757, and GSE66271 clear cell renal cell carcinoma (ccRCC) microarray data sets. (b) The coexpression network of DEGs was constructed by PPI and visualized by cytoscape and the significant module was marked in light red [Color figure can be viewed at wileyonlinelibrary.com]
