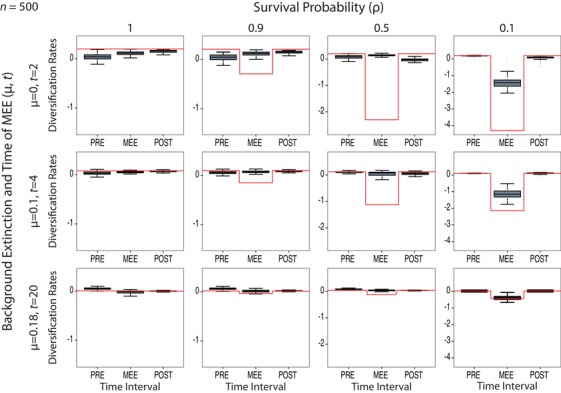
Figure 2.

Detection of MEEs under the BDSKY Model C through sequential changes in the magnitude of the diversification rate (diversification = λ – μ) under varying levels of μ and mass extinction survival probability, ρ. The red line represents the true (simulated) value; this has been adjusted for ρ = 0.1 in the MEE time interval to reflect the effect of the MEE (see text). The boxplots show the variance in the estimated value across simulated trees, depicting the mean of the means of all trees (thicker dark line), the 75–24% interquartile ranges (shaded box) and the post extreme data points (whiskers). Notice that in the high‐extinction scenario (ρ = 0.1), the diversification rate becomes negative in the second time interval, followed by recovery to positive values in the next interval, signaling the presence of the MEE (μ > λ), but that this change is not observed in the control scenario (with no mass extinction, ρ = 1). Figures S3 and S4 show the same results for Models A and B, respectively.
