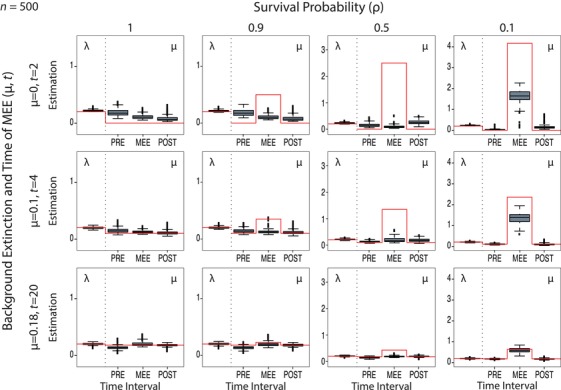
Figure 5.

Estimation of changes in magnitude of μ across time intervals for Model C under different values of background extinction and MEE survival probability, ρ. In this model, λ is estimated but assumed constant over time; that is, MEEs are only detected through changes in the magnitude of μ. The red line represents the true simulated value; this has been adjusted for ρ = 0.1 in the MEE time interval to reflect the effect of the MEE (see text). Notice the large increase of μ (>1) in the MEE time interval for ρ = 0.1, indicating the presence of the MEE, while this effect is not seen in the control scenario (ρ = 1). See Figure S9 for the results with varying values of N (100, 200, and 500).
