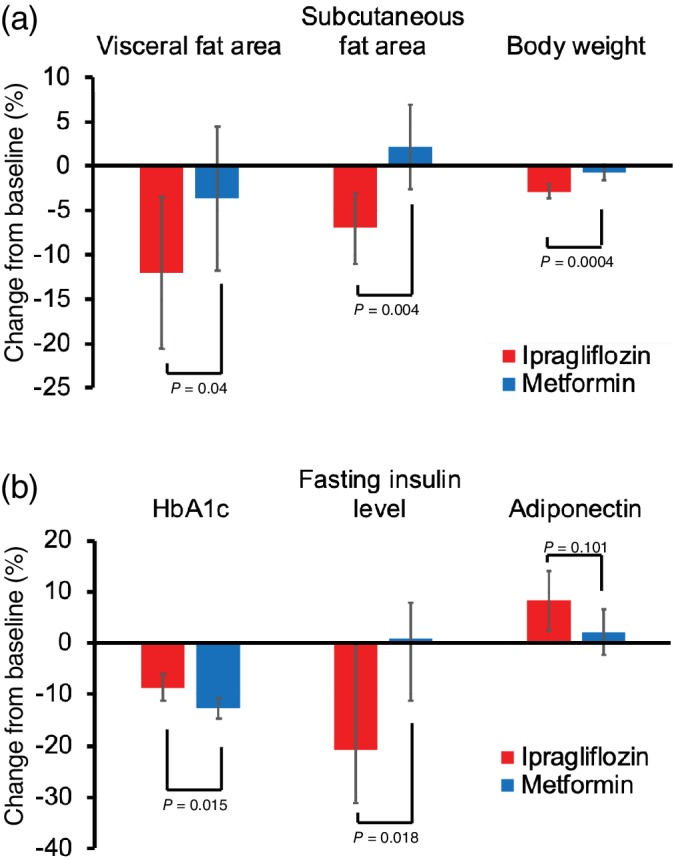
Figure 1.

Change from baseline in visceral fat area, subcutaneous fat area (upper right), body weight, HbA1c, fasting insulin level, and adiponectin after 24 weeks of treatment. Coloured columns show mean values and black bars show 95% confidence intervals
