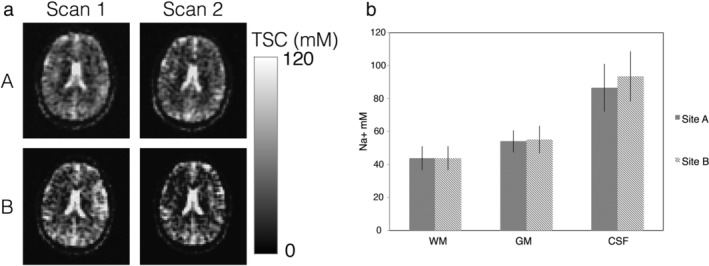
Figure 1.

Mean total sodium concentrations across brain regions from the two sites: (a) Example TSC maps from one subject scanned twice at sites A and B. (b) Mean TSC ± SD for the first scan and all volunteers in segmented WM, GM, and CSF for sites A and B.
