
Figure 3.
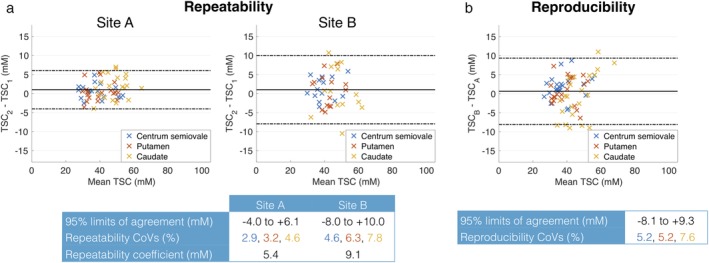
Bland–Altman plots of repeatability and reproducibility for manual segmentation. (a) Repeatability of TSC in three manually defined ROIs, comparing scans 1 and 2 at each site. Individual data points represent the difference in mean TSC between scans for a given subject, plotted against the mean of the mean TSCs. (b) Reproducibility of TSC in manually defined ROIs, comparing subjects' first scan at each site.