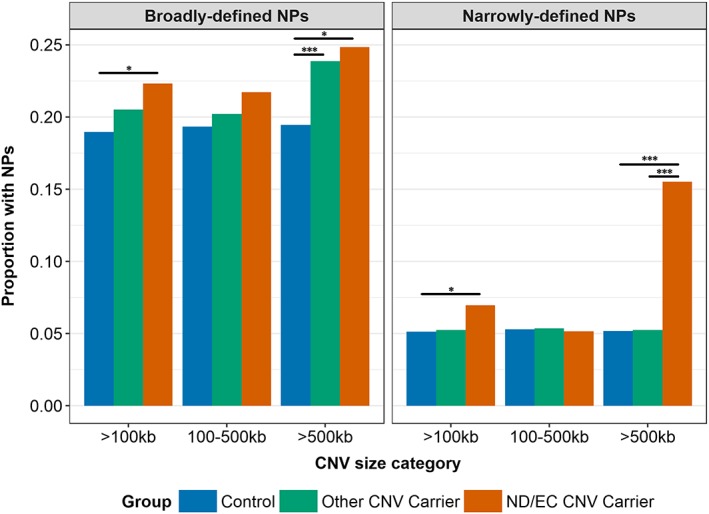
Figure 2.

The proportion of broadly and narrowly defined NPs compared across carriers of CNVs that affect neuropsychiatric disorders or evolutionarily constrained genes (ND/EC CNVs), carriers of other CNVs, and controls who do not carry any CNVs, with CNVs stratified by size. *p < .05; **p < .01; ***p < .001 [Color figure can be viewed at wileyonlinelibrary.com]
