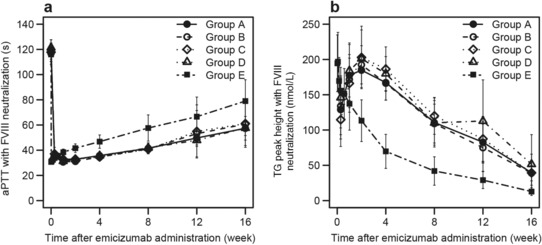
Figure 3.

Mean (± SD) time courses of pharmacodynamic responses in ex vivo factor VIII–neutralized plasma following a single subcutaneous injection of 1 mg/kg with the old drug product into the abdomen (group A), a single subcutaneous injection of 1 mg/kg with the new drug product into the abdomen (group B), upper arm (group C), and thigh (group D), and a single intravenous infusion of 0.25 mg/kg with the new drug product (group E). Data below the quantification range were handled as missing in summary statistics calculations. Summary statistics were not calculated when measured values were below the quantification range in the majority of subjects for each group and time point. a, Activated partial thromboplastin time. b, Peak height of activated factor XI–triggered thrombin generation. aPTT indicates activated partial thromboplastin time; FVIII, factor VIII; TG, thrombin generation.
