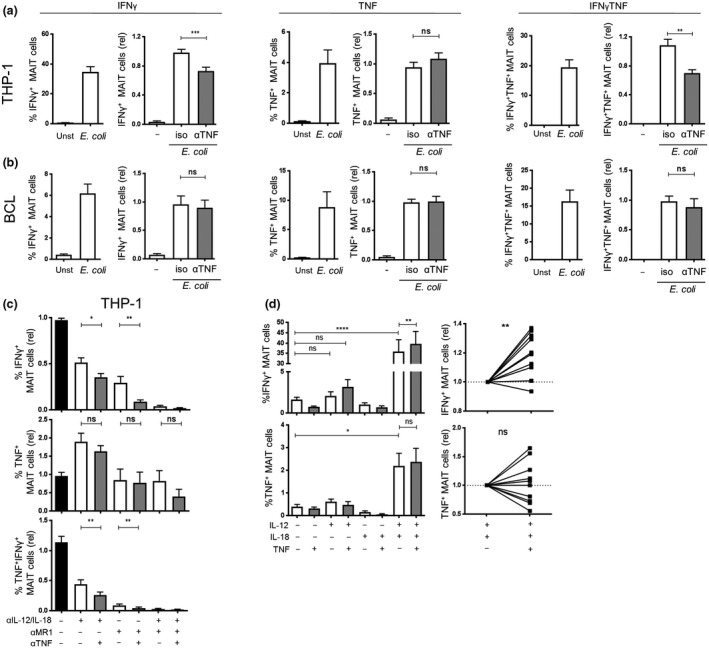
Figure 3.

TNF enhances IFNγ expression of MAIT cells by THP‐1 cells but not by BCLs. Enriched CD8 T cells were co‐cultured for 20 h with THP‐1 cells (a) or BCLs (b) in the absence or presence of E. coli (20 BpC) and an isotype antibody or a TNF‐neutralizing antibody. MAIT cells were analyzed for the expression of IFNγ and TNF. Each graph on the left shows the absolute percentage of the indicated cytokine expressing MAIT cells, and each graph on the right shows the relative percentage of the indicated cytokine expressing MAIT cells after stimulation in the presence of an isotype control antibody or anti‐TNF antibody. (c) Enriched CD8 T cells were co‐cultured for 20 h with THP‐1 cells and E. coli (20 BpC), and the indicated combinations of blocking antibodies for MR1, IL‐12/IL‐18 or TNF. The percentages of MAIT cells expressing IFNγ or TNF are shown. (d) Enriched CD8 T cells were stimulated for 20 h with indicated combinations of recombinant IL‐12, IL‐18 and TNF. The graphs show the percentage (left) of MAIT cells expressing IFNγ or TNF. Right graphs show the effect of TNF on IFNγ or TNF expression of MAIT cells relative to IL‐12/IL‐18 treated cells. Data are shown as mean ± s.e.m. of 11 donors pooled from three experiments performed (for a and b), seven donors pooled from two experiments performed for c or 4–12 donors pooled from one to three experiments performed for d. *P < 0.05, **P < 0.01, ***P < 0.001, ****P < 0.0001, ns = not significant, paired t‐test (a–c) or one‐way ANOVA with Sidak's multiple comparisons test (c).
