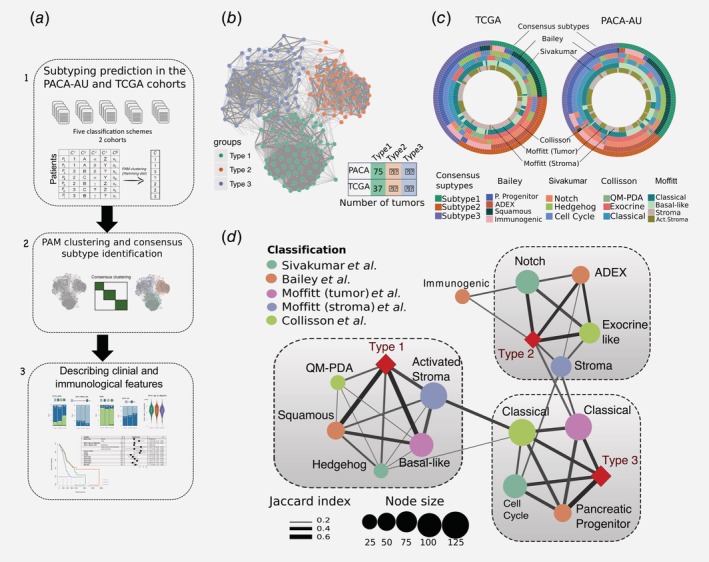
Figure 1.

Identification of the consensus subtypes of PDAC. (a) Analytical workflow of the PDAC subtyping: (1) subtype classification using methodology from five different classification schemes; (2) concordance analysis of the five subtyping labels and application of PAM clustering algorithm to identify consensus clusters; (3) analysis of clinicopathological and immunophenotypes of PDAC consensus subtypes and identification of immune cell signatures with prognostic value in independent PDAC cohorts. (b) Patient similarity network. Each node represents a single patient sample in the PACA‐AU cohort (n = 204). Network edges correspond to highly concordant (at least 5 of 6) subtyping calls between samples. Nodes are coloured according to the three clusters identified from the PAM consensus clustering algorithm. (c) Circular heatmap representing sample overlap for consensus PDAC subtypes and mRNA subtypes from Bailey et al., Sivakumar et al., Collisson et al., or Moffitt et al. (from inside to outside, respectively). Significance of sample overlap was assessed with the hypergeometric test, adjusted p values for each pairwise comparison are depicted in Supporting Information Figure S4. (d) Association of consensus PDAC subtypes identified by PAM clustering (red refers to this study: Type 1, Type 2, Type 3) with tumour labels across five classification systems. Each node corresponds to a single subtype (circles are coloured according to classification study; red diamonds correspond to the consensus subtypes). Edge width corresponds to the overlap between labels assessed by the Jaccard coefficient in the PACA‐AU cohort, only significant edges are depicted (hypergeometric P ≤ 0.05. The three grey rectangles delineate clusters of tumour labels that overlap the three PDAC consensus groups (Type 1–3) with FDR adjusted P ≤ 0.05. [Color figure can be viewed at wileyonlinelibrary.com]
