
Figure 3.
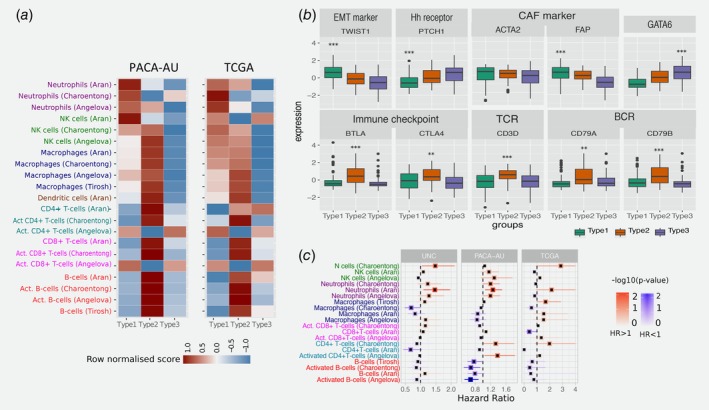
Tumour‐infiltrating subpopulations of immune cells are associated with distinct PDAC subtypes. (a) Heat map of row scaled immune infiltrated scores per immune cell type. Angelova, Charoentong and Tirosh represent single‐sample GSEA scores of signatures for cell types from the corresponding manuscripts. Aran is the inferences produced using xCell algorithm.21 (b) Boxplots showing markers of special interest in PDAC subtypes differentially expressed between groups from the PACA‐AU cohort. Similar trends were observed in the TCGA cohort (Supporting Information Fig. S5). EMT – Epithelial‐mesenchymal transition; Eh – Hedgehog; CAF – Cancer Associated Fibroblasts; TCR – T‐cell receptor; BCR – B‐cell receptor. Asterisks represent significant codes for Welch's t‐test FDR adjusted p values: p < 0.01 ‘**’; p < 0.001 ‘***’. Welch's t‐test was used to test for differential expression of a particular gene in a given subtype compared to all other subtypes. (c) Correlation of tumour infiltrating immune cells with patient overall survival. For three independent cohorts (PACA‐AU, TCGA and UNC), a multivariate Cox proportional hazards regression analysis was performed, with covariates including the enrichment scores of six immune cell types, and when available, patient gender, age at diagnosis, tumour stage and tumour grade. Squares represent the hazard ratio (HR) and the horizontal bars extend from the lower limit to the upper limit of the 95% confidence interval of the estimated of the hazard ratio. The colour scale reflects –log10(p value) and is shown in blue for HR < 1 (good prognosis) and in red for HR > 1 (bad prognosis). [Color figure can be viewed at wileyonlinelibrary.com]