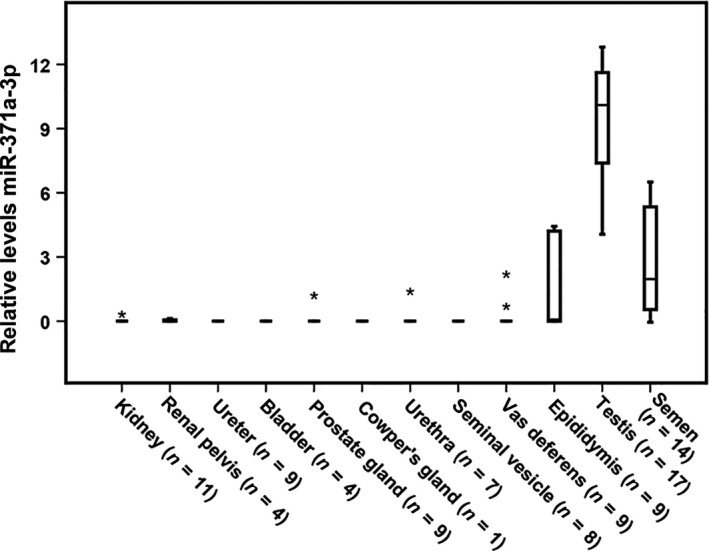
Figure 2.

Detection of miR‐371a‐3p in the male urogenital tract. Boxplots of the relative levels of miR‐371a‐3p are presented (40‐Ct, scale log2), normalized with RNU48. Kidney (n = 11), renal pelvis (n = 4), ureter (n = 9), bladder (n = 4), prostate gland (n = 9), Cowper's gland (n = 1), urethra (n = 7), seminal vesicle (n = 8), vas deferens (n = 9), epididymis (n = 9), testis (n = 17), semen (n = 14), normalized with miR‐20a‐5p. The box marks the first and third quartiles. Horizontal lines mark median values; outliers are indicated with an asterisk. The whiskers indicate the minimum and maximum values.
