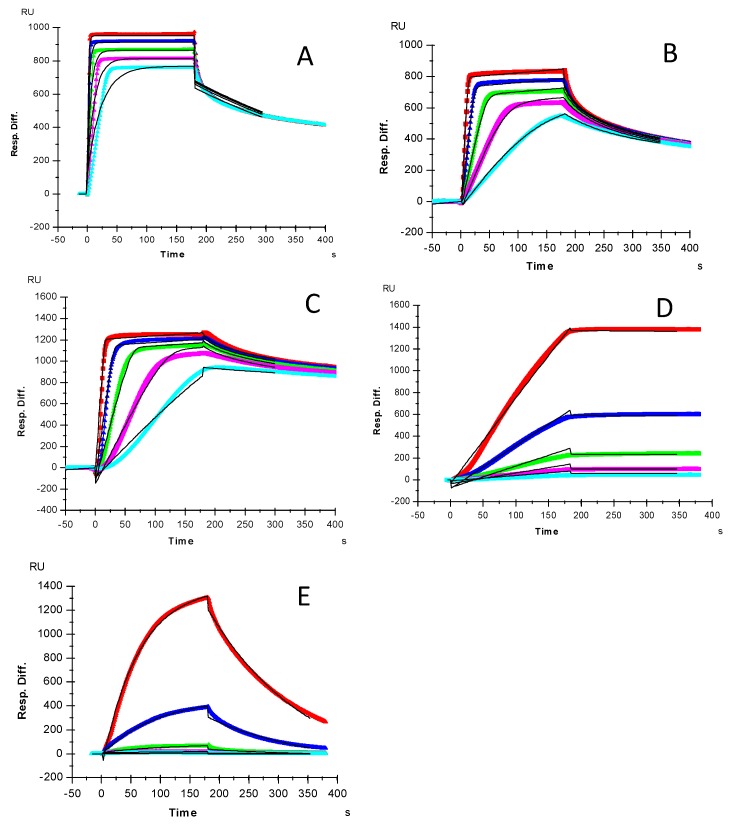
Figure 2.
SPR sensorgrams for binding kinetics/affinity measurements for growth factor-heparin interactions: (A) FGF2, concentrations of the FGF2 (from top to bottom) were 32, 16, 8, 4, and 2 μM, respectively; (B) FGF7, concentrations of the FGF7 (from top to bottom) were: 250, 125, 63, 32 and 16 nM, respectively; (C) FGF10, concentrations of the FGF10 (from top to bottom) were: 250, 125, 63, 32 and 16 nM, respectively; (D) HGF, concentrations of HGF (from top to bottom): 20, 10, 5, 2.5 and 1.25 nM, respectively. (E) TGFβ-1, concentrations of TGFβ-1 (from top to bottom): 100, 50, 25, 12.5 and 6.3 nM, respectively. The black curves are the fitting curves using a 1:1 Langmuir model from BIAevaluation 4.0.1.

