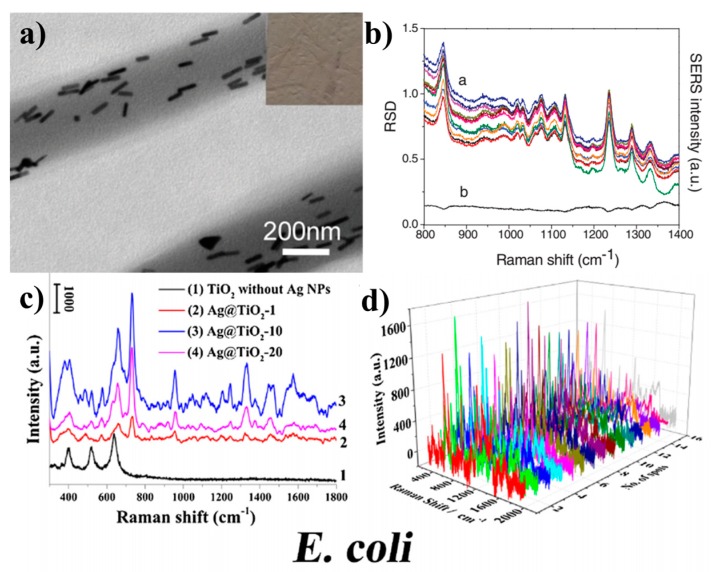
Figure 9.
Electrospun NP interfaces for surface-enhanced Raman scattering (SERS) sensing: (a) TEM image of AuNRs assembled within the PVA nanofibers; (b) relative standard deviation (RSD)-SERS graph (1) SERS spectra of 10–4 M 3,3′-diethylthiatricarbocyanine iodide (DTTCI) collected from 12 randomly selected places on the optimized substrate and (2) the corresponding RSD value curve [123], copyright 2012 Wiley-VCH; (c) SERS spectra taken from bacteria/Ag@TiO2 nanofelts sensing platform with various Tollen’s reagent deposition time (0, 10, and 20 min) and TiO2 nanofibers without AgNPs decorated; (d) overlapping SERS spectra of bacteria/Ag@TiO2-10 nanofibers mats recorded at 16 randomly selected spots for E.coli [124], copyright 2018 Elsevier Ltd.

