Figure 6.
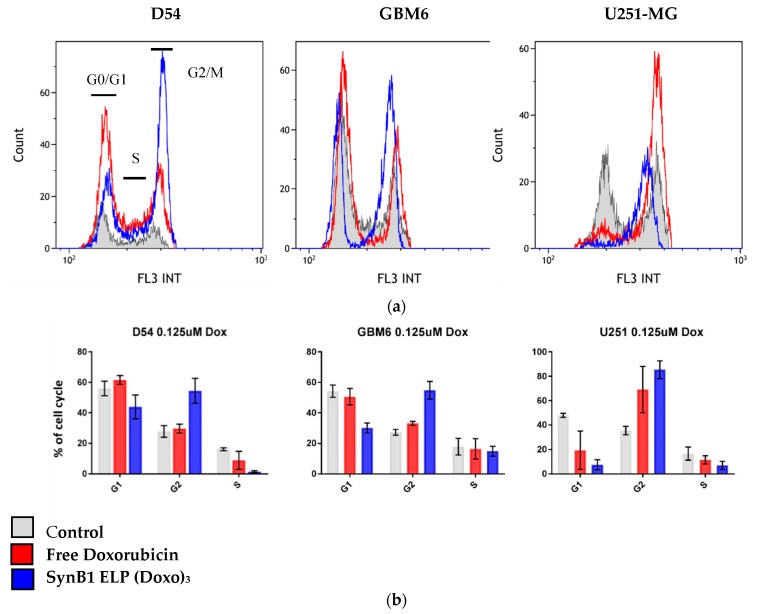
Cell cycle distribution. Cells were treated with 125 nM SynB1-ELP-DOXO or free Dox and analyzed 24 hours after the treatment. Raw data for a representative experiment is shown (a) and an average of three independent experiments is shown (b). Summary of results presented in B were determined by analysis of 10,000 cells per sample, and results represent the mean +/− SEM.

