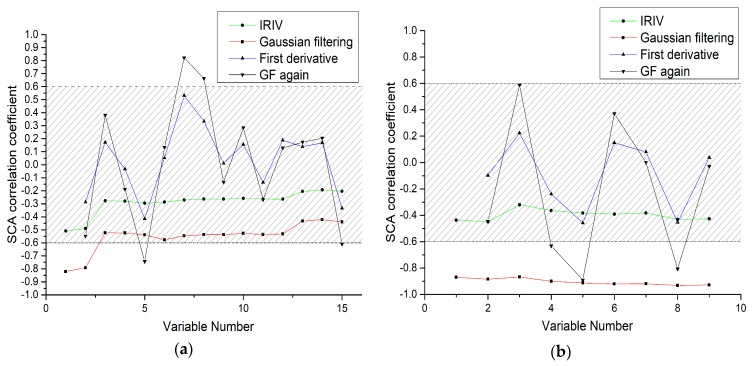
Figure 6.
Correlation coefficients between the different pretreatments and the As concentration of soil. The green line indicates the IRIV spectral reflectance and the As concentration of soil, the red line indicates the Gaussian filtering (GF) spectral reflectance and the As concentration of soil, the blue line indicates the first derivative (FD) spectral reflectance and the As concentration of soil, and the black line indicates the GFA spectral reflectance and the As concentration of soil (a) Laboratory spectra of the soil samples; (b) Field spectra of the soil samples.

