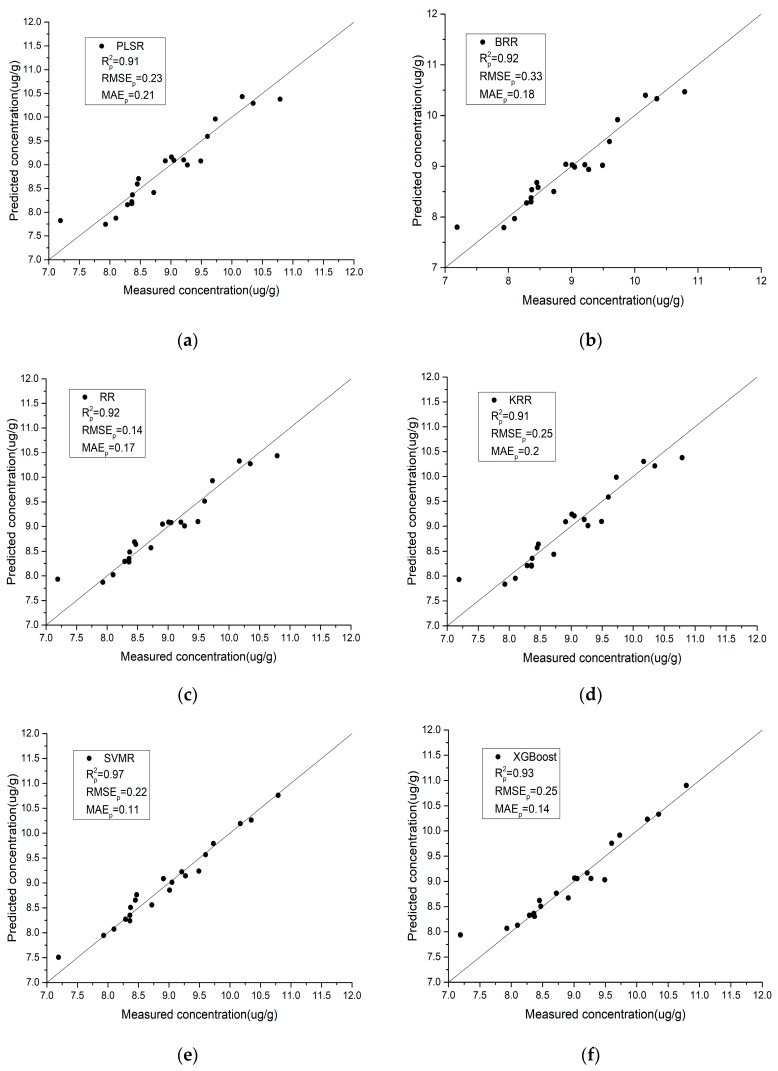
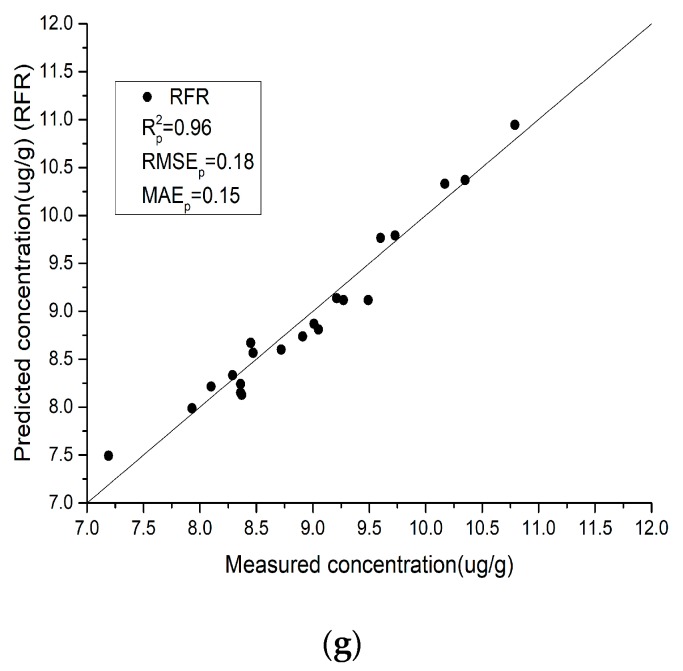
Figure 7.
A comparison between the measured values and predicted values of the different regression models using laboratory spectra. (a) Partial least squares regression (PLSR); (b) Bayesian ridge regression (BRR); (c) ridge regression (RR); (d) kernel ridge regression (KRR); (e) support vector machine regression (SVMR); (f) eXtreme gradient boosting (XGBoost) regression; (g) random forest regression (RFR).


