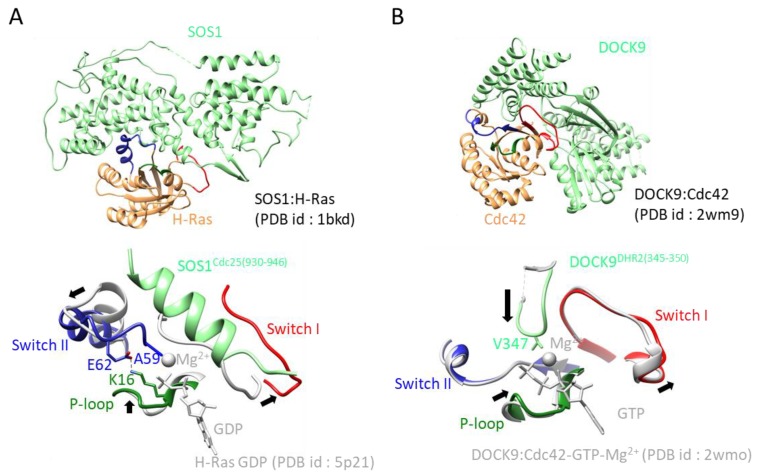
Figure 3.
GEF:GTPase structures and their exchange mechanisms: (A) Upper: overall structure of the SOS1:H-Ras complex. SOS1 and H-Ras are colored green and orange, respectively. The P-loop, switch I, and switch II are colored green, red, and blue, respectively. Lower: Close up view of the active site of the SOS1:H-Ras complex: structural rearrangement is indicated by a black arrow. Key residues for exerting GEF activity are shown as stick models. The color scheme of the complex follows that of upper figure. The structure of the GDP-bound form of H-Ras, including GDP and Mg2+, is overlaid and colored in gray. (B) Upper: overall structure of the Dock9:Cdc42 complex. The structure of the GDP-bound form of Cdc42, including GTP and Mg2+, is overlaid. Lower: Close up view of the active site of the Dock9:Cdc42 complex. The color scheme and other descriptions follow those of Figure 1B.

