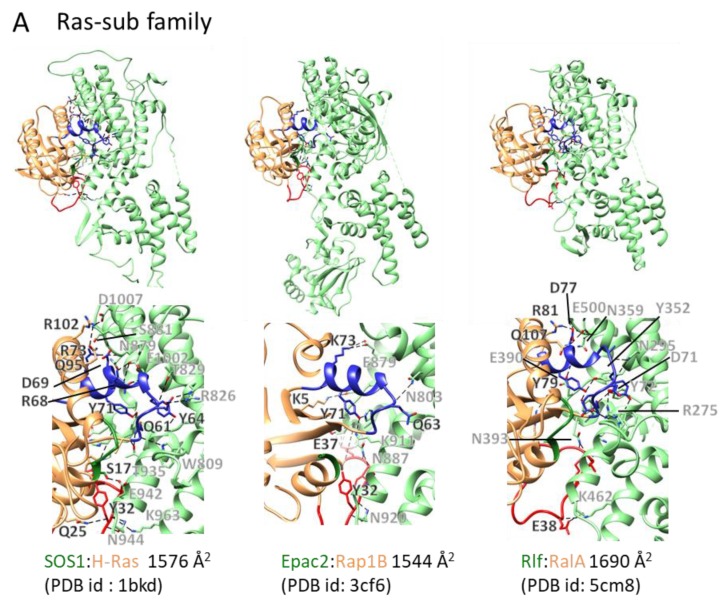
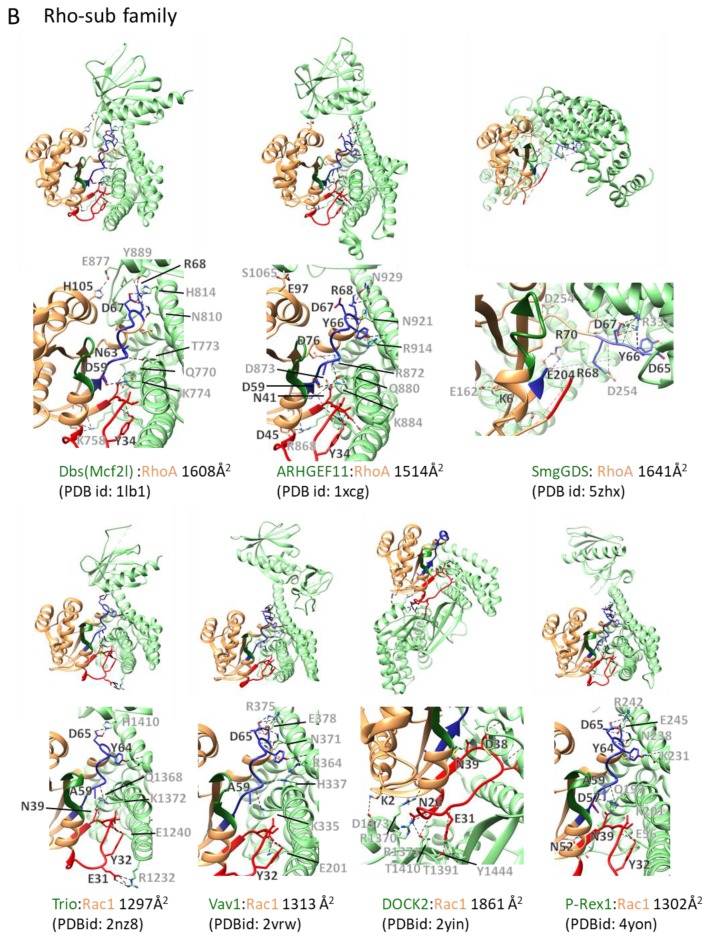
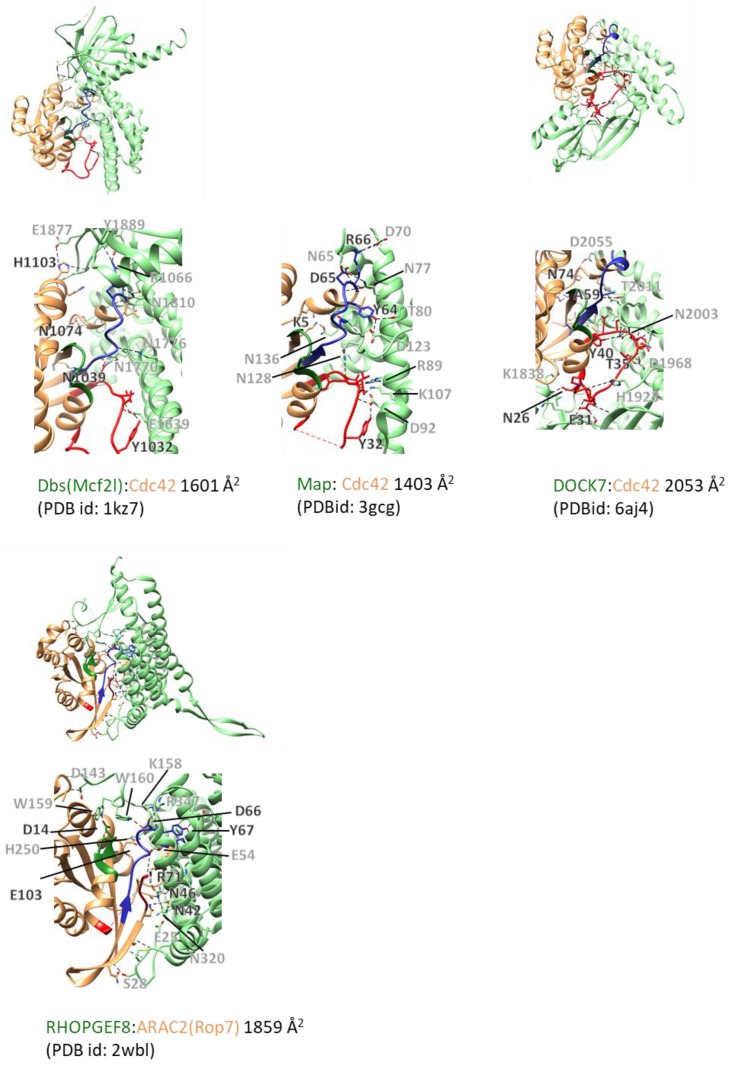
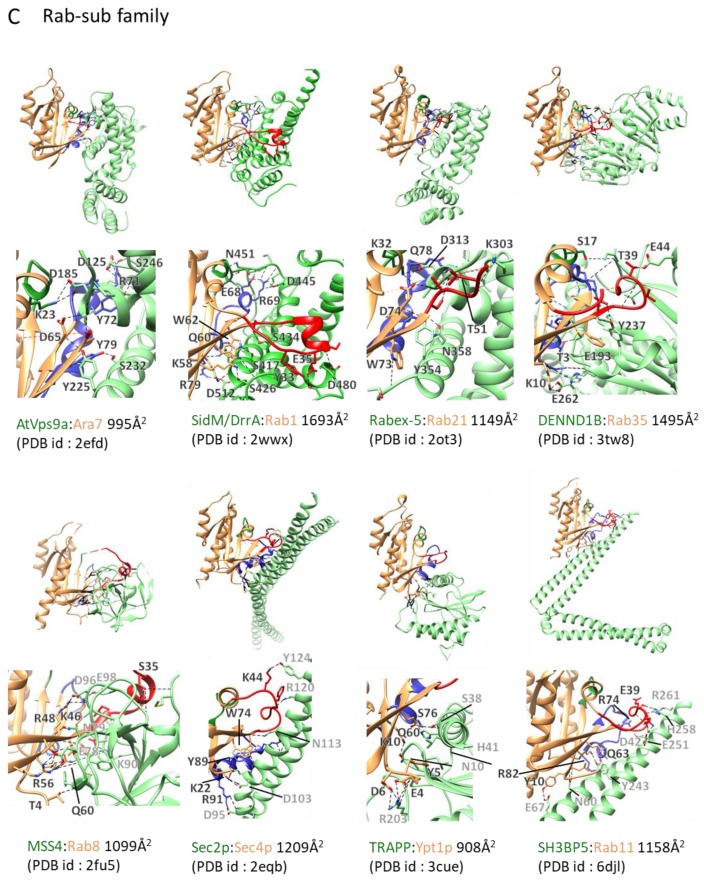
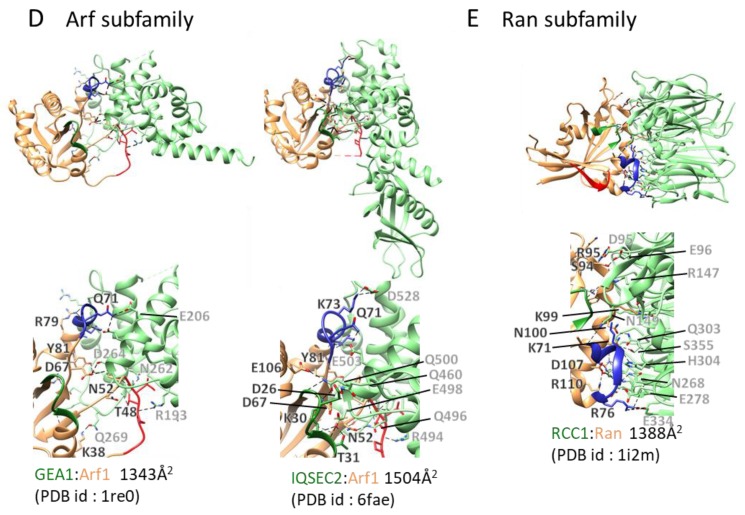
Figure 4.
GEF:small GTPase complex structures and their interacting interface: GEF:small GTPase complex structures in the ligand unbound forms were drawn. The color scheme and other descriptions follow those of Figure 1B. Dashed lines depict hydrogen bonds or electrostatic interactions. The interaction areas and Protein Data Bank (PDB) ids are shown. (A) Ras subfamily. (B) Rho subfamily. (C) Rab subfamily. (D) Arf subfamily. (E) Ran subfamily.

