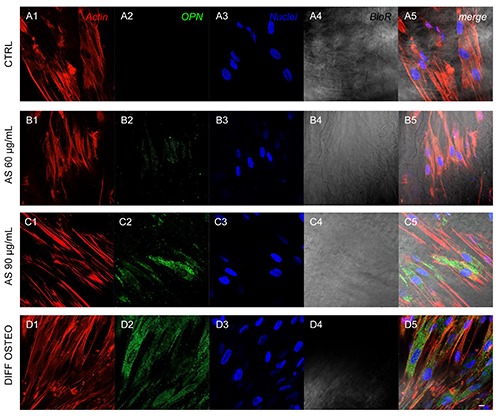
Figure 7.

Expression of OPN. Immunofluorescence detection of OPN in CTRL(A1-A5), AS 60 μg/mL (B1-B5), AS 90 μg/mL (C1-C5) and DIFF OSTEO (D1-D5). OPN expression showed a higher expression in AS 90 μg/mL and DIFF OSTEO if compared to the AS 60 μg/mL. No significant differences have been demonstrated when compared AS 90 μg/mL and DIFF OSTEO groups. Red fluorescence, cytoskeleton actin; green fluorescence, specific marker; blue fluorescence, cell nuclei; grey scale, membrane observed at transmission light channel; merge pictures showed the overlapping of abovementioned channels. Scale bar: 10 μm.
