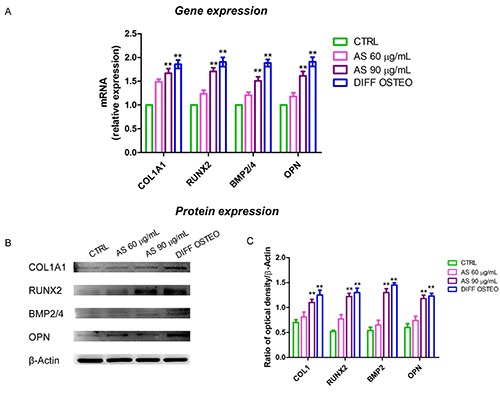
Figure 8.

Gene and protein expression. A) Bar graph of RT-PCR showed the expression of mRNA levels in CTRL, AS 60 μg/mL, AS 90 μg/mL and DIFF OSTEO of specific osteogenic related markers. B) COL1A1, RUNX2, BMP2/4 and OPN specific bands of CTRL, AS 60 μg/mL, AS 90 μg/mL and DIFF OSTEO samples. C) Graph bar showed the densitometric analysis of specific band of the markers related to the osteogenic process. The results are expressed as mean ± SD; AS 60 μg/mL vs AS 90 μg/mL; 60 μg/mL vs DIFF OSTEO; **P<0.01.
