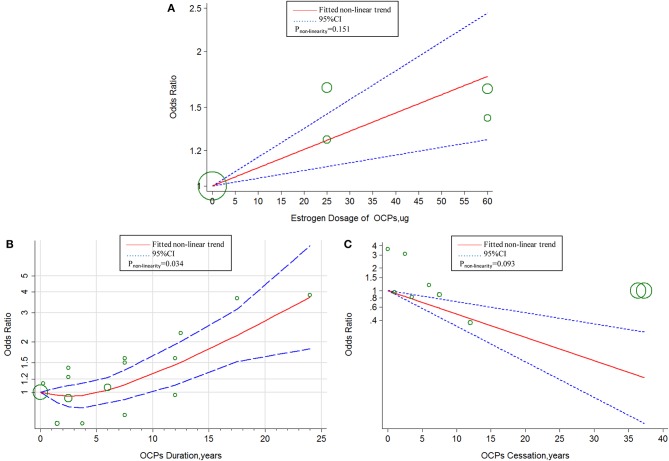
Figure 6.
Dose–response relationship between OCPs [(A) estrogen dosage of OCPs, (B) OCPs duration, (C) OCPs cessation] and risk of hemorrhagic stroke. The circles represent the ORs in each individual study with the circular size reflecting the weight of corresponding study; OCP, oral contraceptives.

