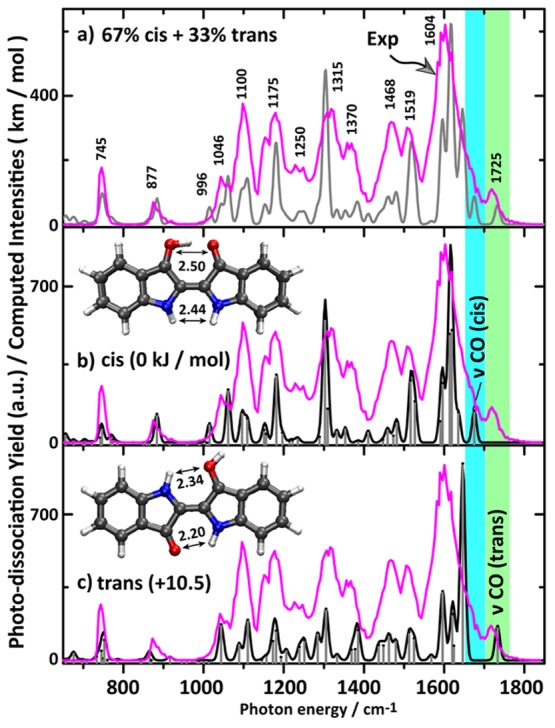
Figure 1.

(a) Gas-phase IRMPD spectrum of protonated indigo (magenta trace) with band centers for the main experimental bands indicated. The experimental spectrum is compared with computed spectra for (b) the cis- and (c) trans-isomer. The gray trace in (a) represents the aggregate spectrum of cis- and trans-isomers assuming fractional populations as suggested by the kinetic measurements described in the text. Computed intensities in km mol–1 refer to the stick spectra. The optimized structures along with their relative Gibbs energies are shown. Atomic distances shown are in Å.
