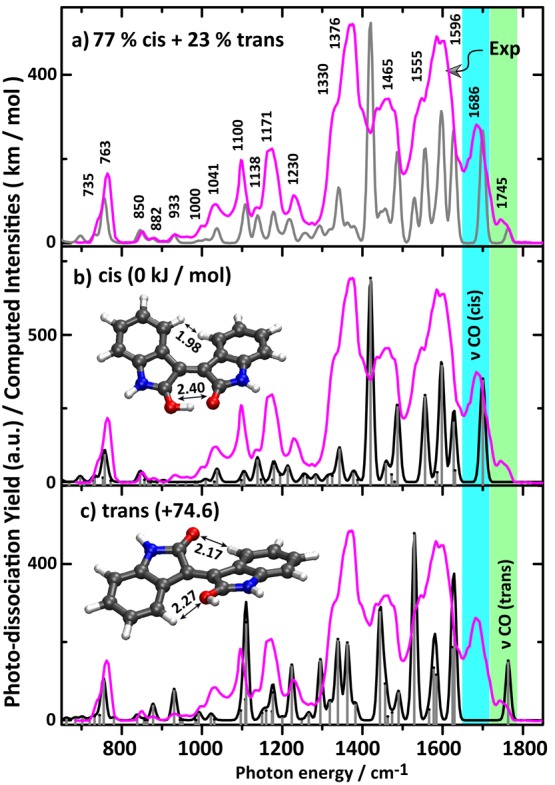
Figure 2.

(a) Experimental IRMPD spectrum of protonated isoindigo (magenta trace). (b) Overlay of the experimental spectrum with the calculated IR spectrum for the cis-isomer and (c) with that of the trans-isomer. The gray trace in (a) represents a composite computed spectrum with 77% cis and 23% trans, as suggested by the kinetic measurements described in the text. Optimized structures along with the relative Gibbs energies are shown as well as some relevant atomic distances (in Å).
