
Figure 2.
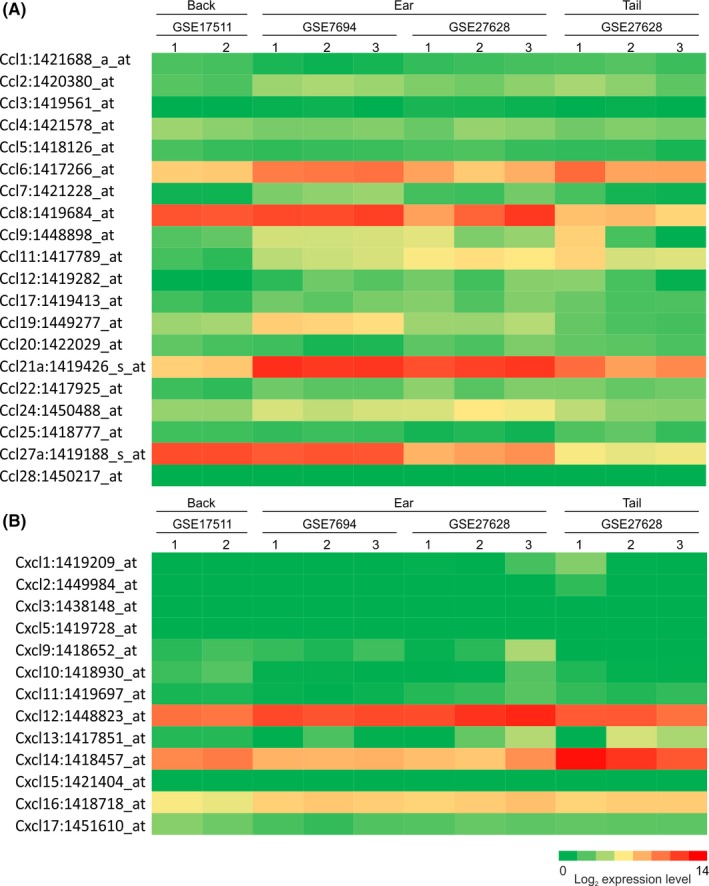
Retrospective comparison of chemokine gene expression in mouse skin. Heat maps show the expression of profile of multiple CCL (A) or CXCL (B) chemokine‐encoding probe sets in the samples of back, ear and tail skin (GEO accession codes: GSE17511; GSE7694; GSE27628). These data were performed on Affymetrix MOE430_2 mouse genome expression arrays (Affymetrix, Santa Clara, CA). Each column represents the mean probe set intensity (log2) for individual data sets (samples) from each source. Representative probe set are shown when multiple probe sets for a gene were present on the arrays